

SIRS Information for Instructors
SIRS – Monitoring Survey Progress and Response Rates
After the survey begins and students start responding, instructors and administrators can view the response rate to gauge the survey progress. Only the overall percentage of completion is viewable; you cannot see whether individual students have completed the survey or not.
Enrollment data is updated daily, and students who withdraw from a course will not have access to the survey. However the enrollment numbers will still count withdrawn students, and the final enrollment number will update when the survey ends.
Instructions
- Log in to the Blue survey system at https://sirs.rutgers.edu/blue
- There are two methods to view response rates:
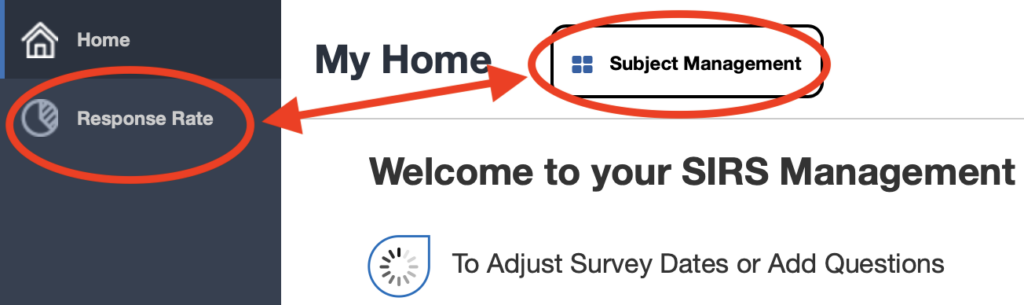
- You can view the response rates for individual courses using the unified page for survey management. To do so, click the “Subject Management” button at the top of the screen. You can also go directly to the Survey Management page.
- For an overview of the cumulative response rate with breakdowns by course, click the “Response Rate“ link in the left-hand margin. You can also go directly to the Response Rate Dashboard.
- From the “Subject Management” page, each tile will change to show the response rate as soon as the survey starts.
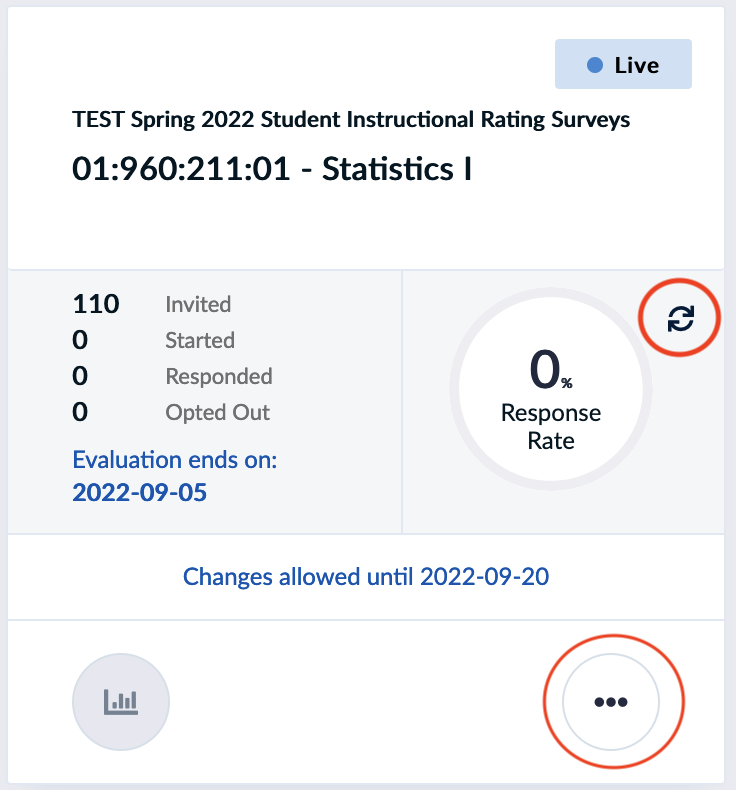
- Click the circular-arrows icon
 to refresh the response rate and see up to the minute changes.This is useful when having the students complete the survey in class and you want to get live updates on the survey progress.
 - Clicking the
 icon allows instructors to view the current enrollment for the course, but does provide any additional information. Withdrawn students may still appear here, but will not have access to the survey and will be removed prior to report distribution.
 - The icon also provides access to a distinct link that faculty can give students to go directly to this survey, and a “QR code” for displaying the link in the classroom.
- From the Response Rate dashboard, you will see graphs that show the cumulative response rate for all courses that you are monitoring. For department administrators or deans, this will be the overall response rate for your department or school.
- Below the charts are tables with breakdowns for each course. Scroll to the right to see the “Invited”, “Completed” and “Response Rate” columns. This list can be exported into Excel.
- Students also have access to the Response Rate dashboard, which will show them the response rates for courses in which they are enrolled. This can be useful if you are using the response rate as an incentive to encourage survey completion. The link for students to view the response rates for their own courses is https://sirs.rutgers.edu/monitor .
- The final set of graphs at the bottom of the page show more technical details about surveys, including the timing of the email reminders and student responses.