Mapping By Course

Dashboard for curriculum mapping, showing total of program courses, course learning outcomes, and total mappings.

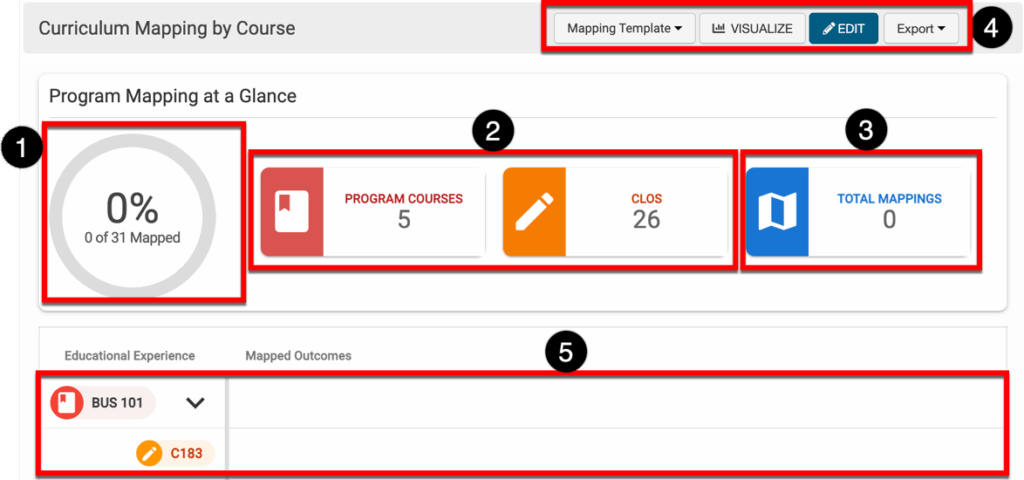
The Program Mapping at a Glance displays quick-glance information about the program’s curriculum map; a percentage of mapping based on the courses and their mappings will be auto-calculated once at least one mapping exists (1) (courses must have at least one outcome mapped to be calculated). The total courses and course learning outcomes(CLOs) added via the Educational Experiences page (2), and total mappings (3). Various functions are available via the top buttons (4); curriculum mapping can be done in bulk via a mapping template or individually via drag-and-drop by clicking Edit, and visualization and export options (PDF and print) are available. A view-only display of a program’s curriculum map is also available (5).

Curriculum Mapping by Course

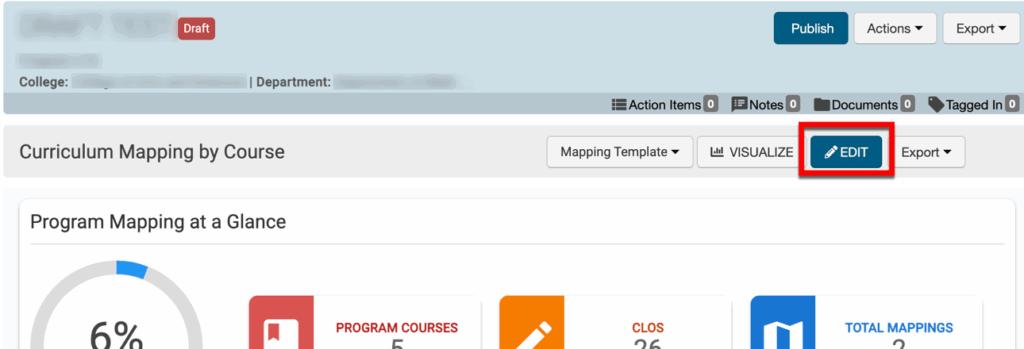
  1. To perform curriculum mapping via the platform interface, navigate to Program Homepage > Mapping by Course and click Edit.
Curriculum Mapping by Course interface showing where to find the Edit button.
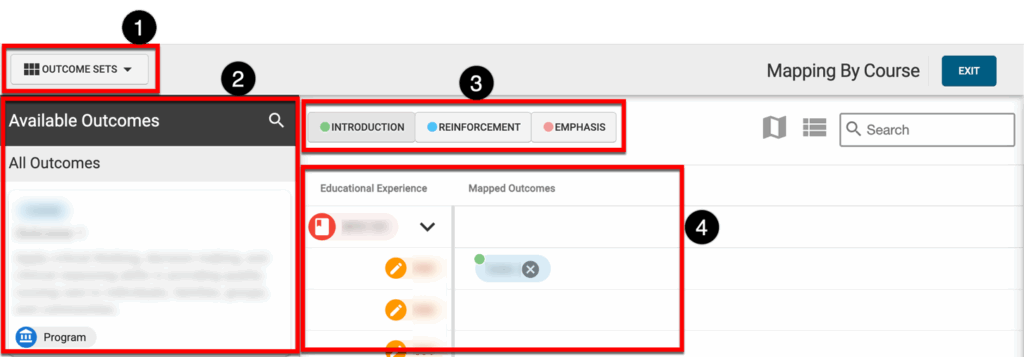
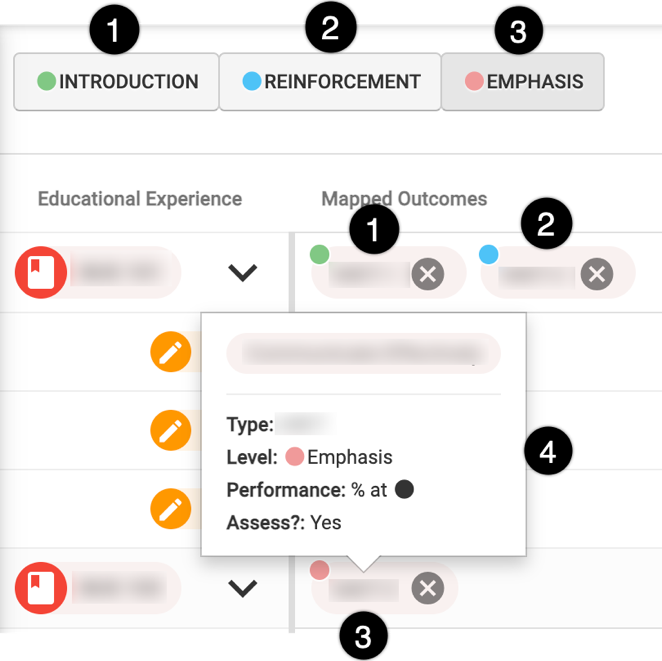
  1. By clicking Outcome Sets (1), outcome sets available for selection (2) can be filtered by level. By selecting the button for each level (3), the developmental level for mappings can be defined; in the screenshot below, the default level titles are shown. Once mappings exist, developmental levels will be color-coded. Mappings can be hovered over for quick-glance information or clicked for further configuration options (4).
Outcome Sets mapping to course interface. At the top left, there is a button labeled "OUTCOME SETS" with an icon, located in a horizontal navigation bar. Below it, there's a column titled "Available Outcomes," displaying multiple outcomes with associated labels, such as a "Program" tag. Next to this, there are tabs labeled "INTRODUCTION," "REINFORCEMENT," and "EMPHASIS," each outlined in different colors (green, blue, and pink, respectively). To the right, another section shows columns titled "Educational Experience" and "Mapped Outcomes," with icons for editing and mapping, including a cancel symbol. The top right of the screen shows a "Mapping By Course" label and an "EXIT" button.
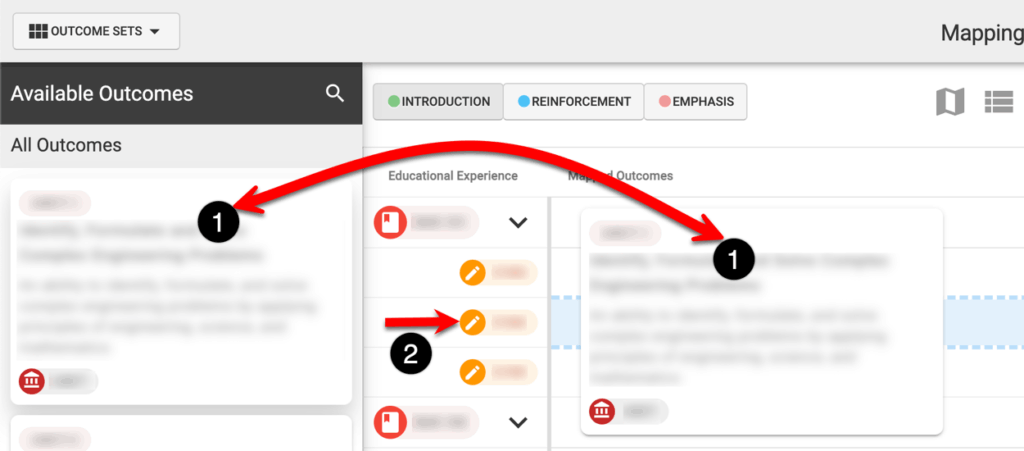
  1. To map an outcome to a course, click and hold an outcome (1) and drag it to the row of a course or CLO (2). In the example below, an outcome is dragged and dropped to the second CLO for a course at the Introduction developmental level.
On the left, there is a panel titled "Available Outcomes" with a searchable list of outcomes. The right side contains sections for "Educational Experience" and "Mapped Outcomes." Two large, red arrows labeled with numbers guide the viewer’s attention. The first arrow points from an outcome on the left panel, labeled with the number 1, to a corresponding outcome on the right. The second arrow, labeled with the number 2, points to an orange edit button in the "Educational Experience" section. The top of the screenshot displays tabs labeled "Introduction," "Reinforcement," and "Emphasis" in green, blue, and red, respectively.
  1. Once an outcome has been mapped, the development level can easily be identified by the color-coded levels (1, 2, 3), and hovering over a mapped outcome will display quick-glance information (4).
At the top, there are three color-coded categories: green labeled "INTRODUCTION," blue labeled "REINFORCEMENT," and pink labeled "EMPHASIS." Below these, a table layout is partially visible with headings "Educational Experience" and "Mapped Outcomes." The "Educational Experience" column shows three entries with icons next to them—a red bookmark and orange pencils, indicating possible actions. The "Mapped Outcomes" column features circular icons, each corresponding to a category, showing different levels with green, blue, and pink circles. A text overlay box contains blurred content and labels such as "Type," "Level: Emphasis," "Performance: % at," and "Assess?: Yes," with emphasis on pink.
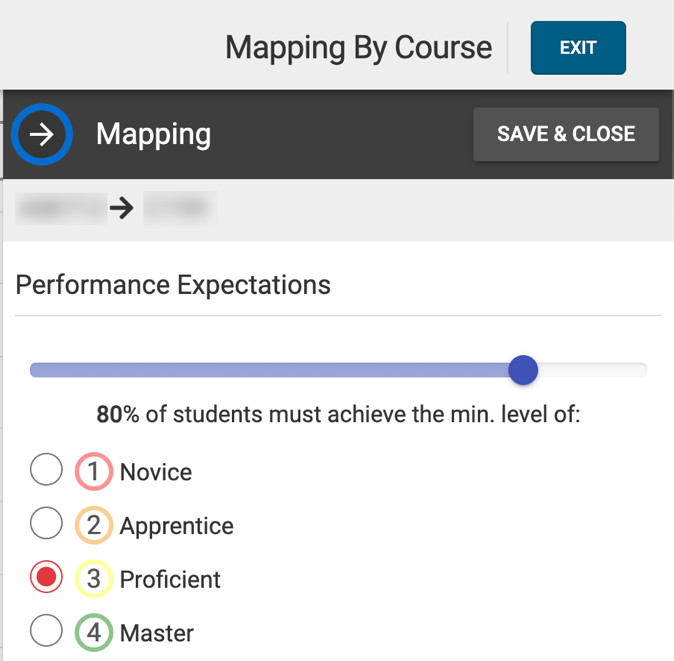
  1. Mapped outcomes can be clicked to open the Mapping drawer.
    • If performance expectations have not been locked at a higher level of the Organizational Hierarchy, the expectation for the mapping can be configured for individual outcomes as needed.
Outcome Mapping interface showing performance expectations with options: Novice, Apprentice, Proficient, and Master.
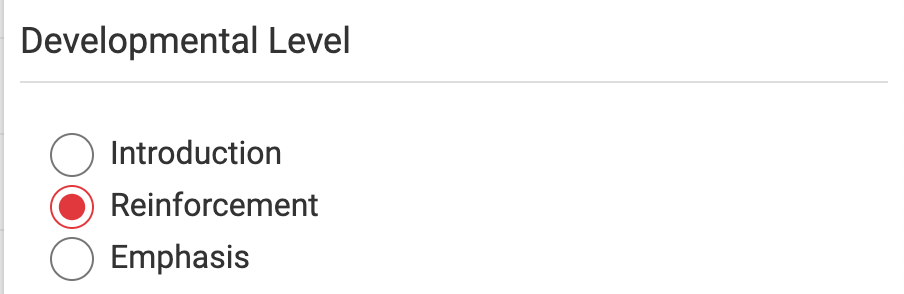
  1. Developmental Levels can be adjusted by selecting a different level in the Mappings drawer.
Developmental Level options showing Introduction, Reinforcement, and Emphasis.
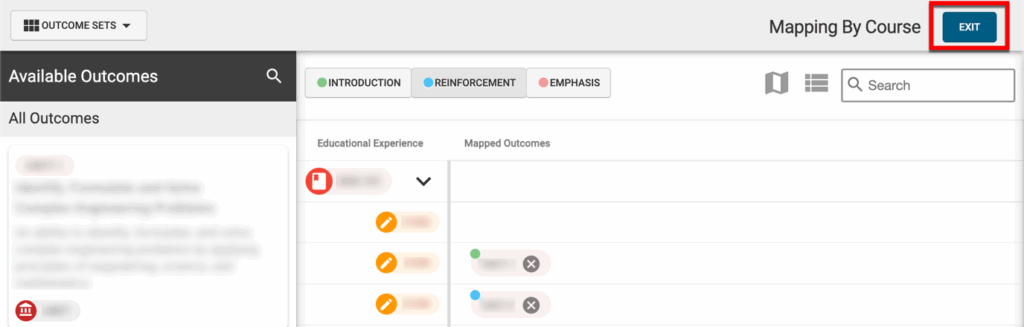
  1. To complete mapping, click Exit to return to the Mapping by Course page. Outcome mappings will not be effective until the program is published.
Mapping by Course interface showing where the Exit button is to complete the mapping process.